 Skip to content
Running now · Operations · monitoring
Signalpost
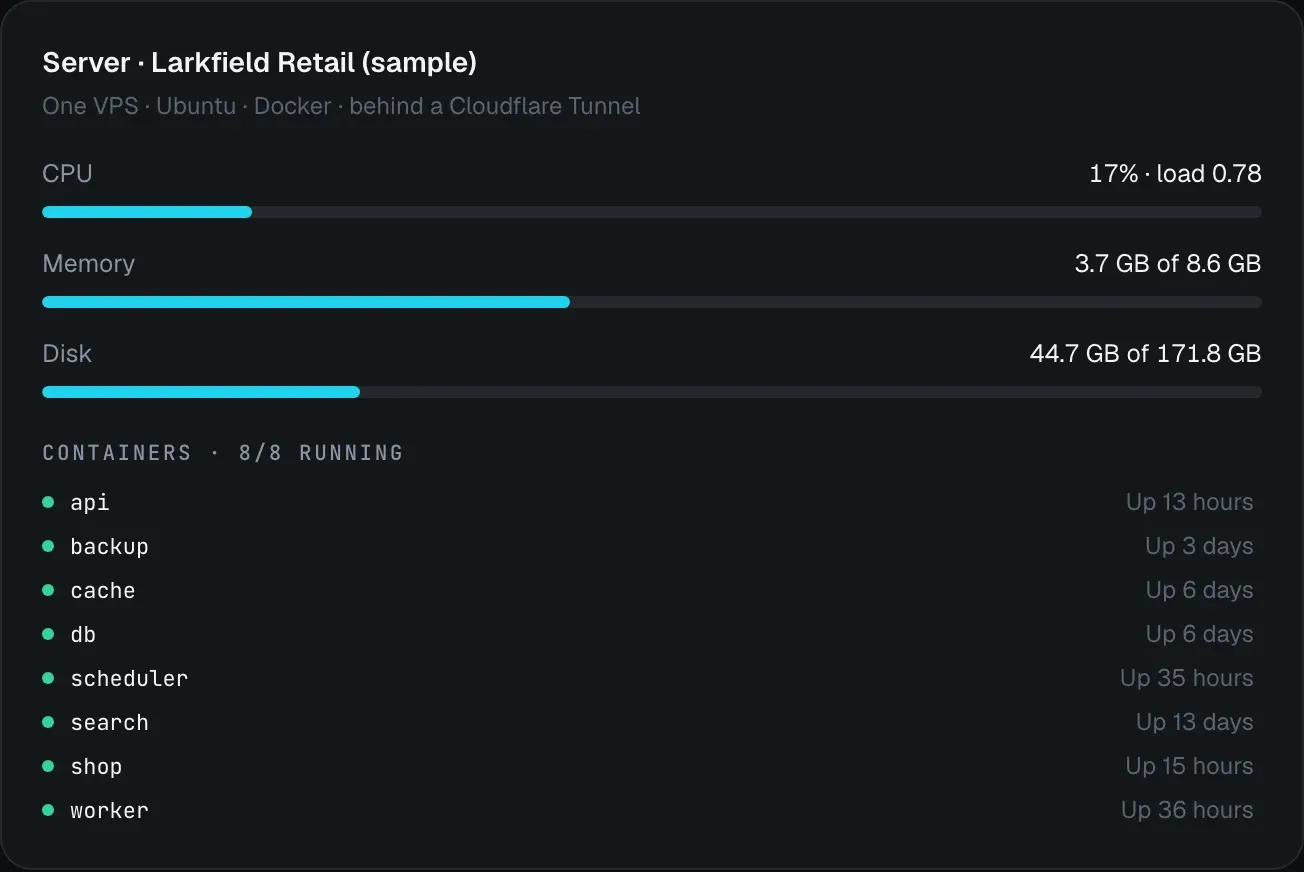
Monitoring and a status page for everything we run: every service checked from inside the server and over the internet, with incidents that open, alert and close on their own.
Try it here
Read the service checks, then use the isolated incident drill to see detection and recovery.
The problem
Most systems run on a default server with nobody watching. A site goes down and a customer is the first to notice; a certificate expires; email lands in spam because a DNS record is missing.
What it does
What Signalpost shows is real: the live state of the server our systems run on. Two failed checks in a row open an incident and send an alert; two good ones close it, with a timeline of what happened.
It also checks the server’s posture: certificate expiry, database and web ports closed on the public address, and the email records (MX, SPF, DKIM, DMARC) read from live DNS. It reports what is missing, too.
Anyone can run the incident drill: a test service inside Signalpost fails for two and a half minutes, and you watch detection, the alert and the recovery. The real services are never touched.
What is in it.
- 01Checks every 30 seconds inside, every 60 seconds outside
- 02Incidents that open and resolve on their own
- 03Server and container health
- 04Certificate expiry and closed-port checks
- 05Email authentication checks
- 06An incident drill anyone can run
Built with
- Node.js
- Fastify
- SQLite
- React